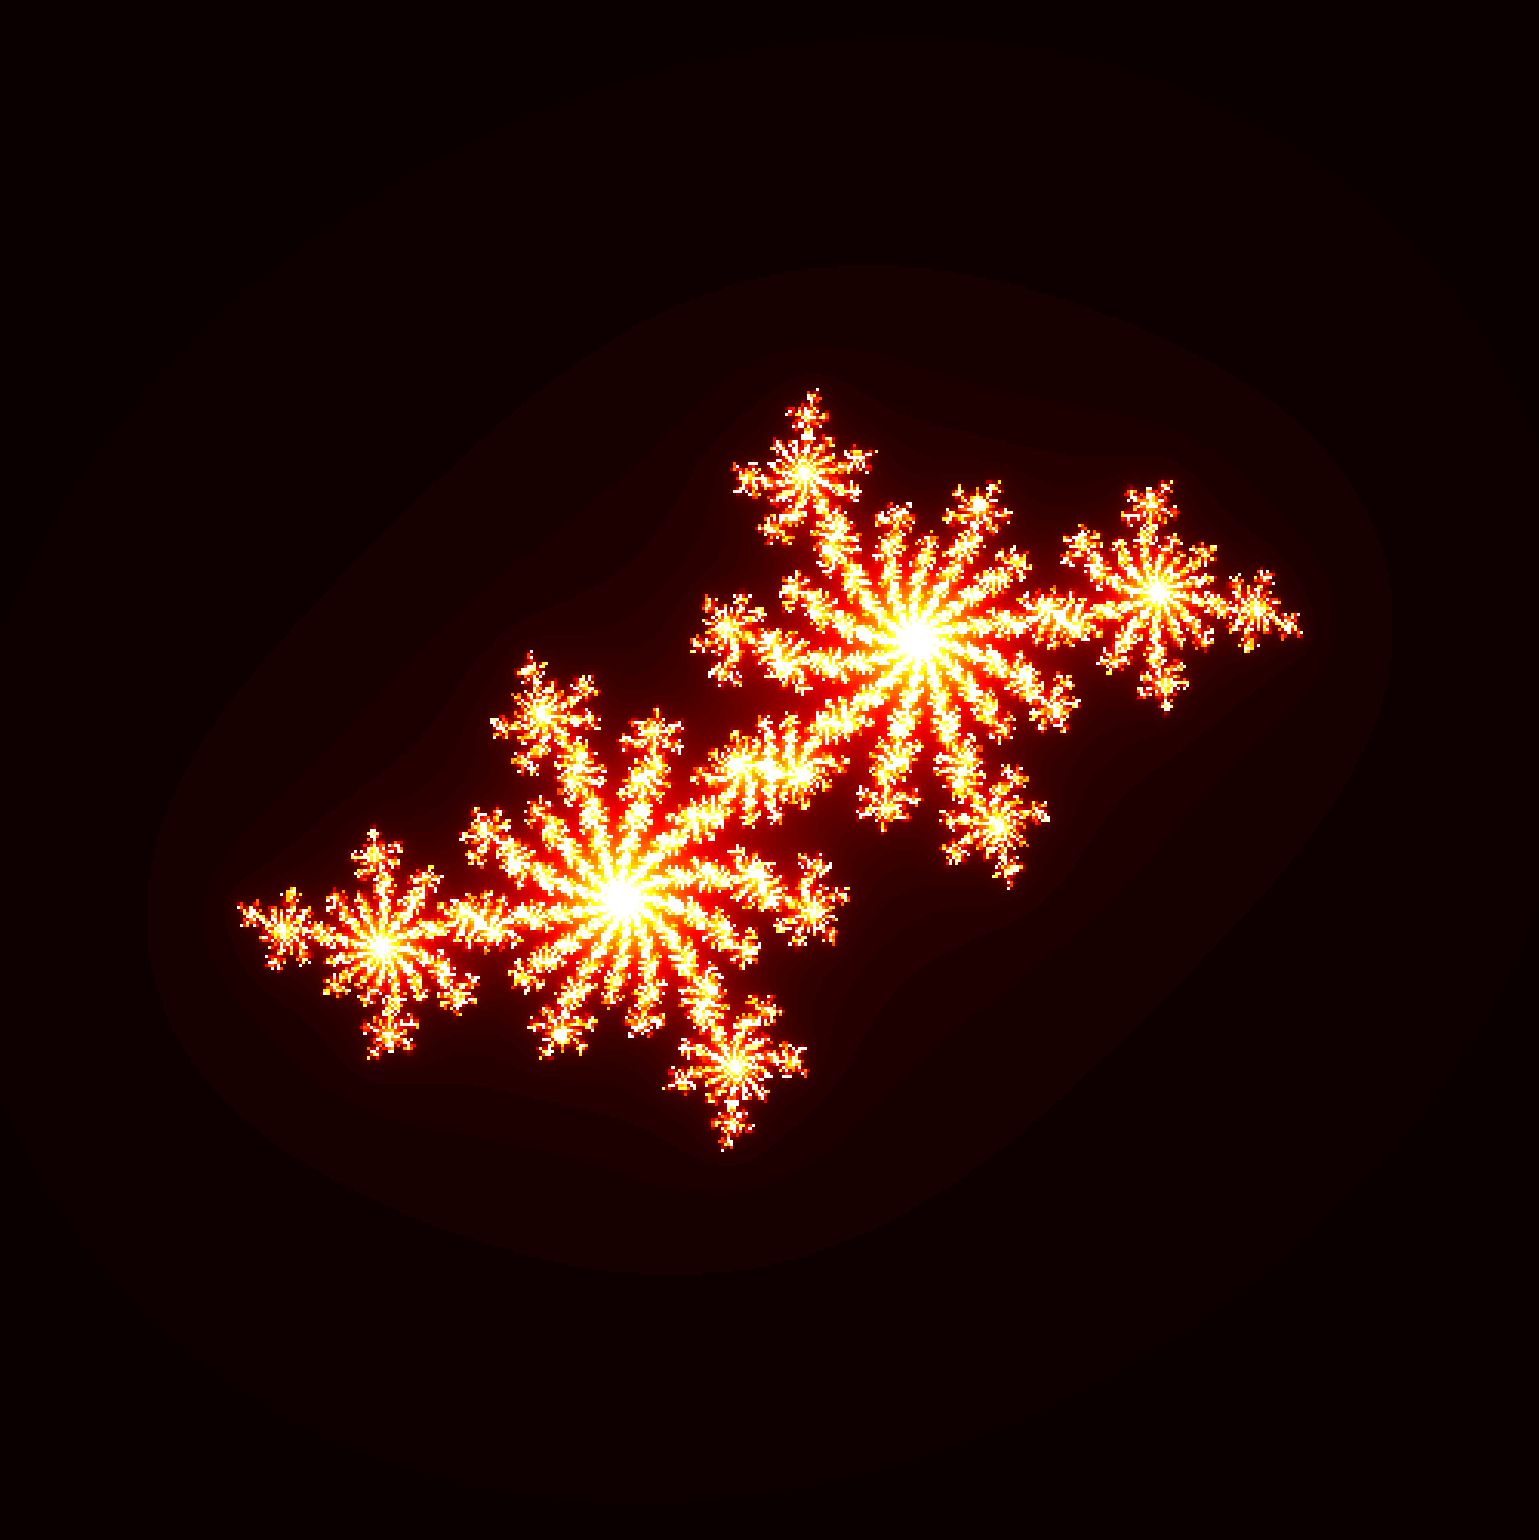
The Julia Sets were discovered by a French Mathematician named Gaston Julia. In general terms a Julia set is the boundary between points in the complex number place or the Riemann sphere that diverge to infinity and those that remain finite under repeated iterations of some mapping. The Mandelbrot set is the most famous example of a Julia Set.
Below you can generate your own Julia Set. It is using the numpy and matplotlib modules in python and generating a heat map. The code is running within an iframe using a trinket.io environment. If the cursor is blinking then it's generating the plot, if it goes away and nothing happens then try run it again. It can be a bit temperamental so try not moving your mouse while it's generating. Some interesting values for the Julia set are:
- -0.42 + 0.6i
- -0.54 + 0.54i
- 0.355 + 0.355i
- 0.37 + 0.1i
You can experiment with other values!
This is the code that it is running if you'd like to try locally
# Importing all necessary modules
import numpy as np
import matplotlib.pyplot as plt

# Defining the function
def Julia(n_rows, n_columns, iterations, cx, cy):
    x_cor = np.linspace(-2, 2, n_rows)
    y_cor = np.linspace(-2, 2, n_columns)
    x_len = len(x_cor)
    y_len = len(y_cor)
    output = np.zeros((x_len,y_len))
    c = complex(cx, cy)
    for i in range(x_len):
        for j in range(y_len):
            z = complex(x_cor[i], y_cor[j])
            count = 0
            for k in range(iterations):
                z = (z * z) + c
                count += 1
                if (abs(z) > 4):
                    break
            output[i,j] = count

    plt.figure(figsize=(20,20))
    plt.imshow(output.T, cmap='hot')
    plt.axis("off")
    plt.show()

# Asking for the inputs
cx = float(input("Set the real value:"))
cy = float(input("Set the imaginary value:"))

Julia(1000, 1000, 100, cx, cy)
Fractal Presentation
